Managing Official Development Assistance (ODA) in an emergency context: how data-driven adaptive management can support the COVID-19 response
Governments in low- and middle-income countries – such as many across Africa, Asia and Latin America – are facing difficult decisions on how to absorb the economic impact of the COVID-19 pandemic and protect the most vulnerable groups within their societies. The crisis also risks undermining the effectiveness of donor government interventions delivering Official Development Assistance (ODA) in these countries. It has demanded extraordinary flexibility from ODA programmes to adapt their activities while retaining focus on the results interventions are delivering.
To support the global economic recovery, donor governments must apply data-driven adaptive management principles and techniques to make evidence-based changes to ODA portfolios and monitor their impact. Adaptive management doesn’t mean changing goals during implementation. It’s an intentional approach to making decisions and adjustments in response to new information and changes in context, and adapting in response to complex unforeseen challenges.
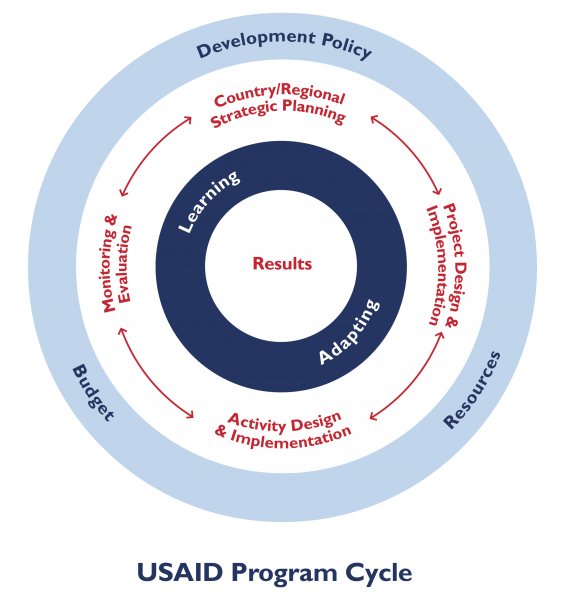
ODA interventions must have rapid learning and feedback mechanisms in place to inform change. A flexible implementation model will support ‘on the ground’ decision making. The image below details the US Agency for International Development’s programme cycle, the interrelation of strategic planning, intervention design and monitoring & evaluation of ODA activities, and the importance of adapting and learning to delivering results.

In times of crisis we must turn to data, and use it to address complexity
We’ve identified three ways ODA donors can use data-driven adaptive management to support the COVID-19 response:
1. Use indicators to build a results story, measure ongoing success, and plan for different scenarios
ODA programmes use a range of indicators to measure and track the results and success of their activities. They should incorporate new indicators to reflect adjustments to activities in response to a crisis like COVID-19. Programme dashboards and reports should provide a comprehensive view of technical (delivery of activities against agreed milestones), financial (expenditure against budget forecast) and contractual (service levels, performance, compliance) data. These metrics are simple to track and usually part of delivery partners’ contractual obligations.
The right indicators, measured accurately, can also unleash the power of scenario planning. ‘What-if’ analysis can be a powerful tool in an uncertain context – with predictive analytics able to anticipate issues and understand the potential impact of changes. We’ve used this approach to help organisations plan for high-impact risks, such as key stakeholders or delivery teams being infected with COVID-19, to map out the consequences for programmes and ensure appropriate business continuity measures are in place. This can be applied from a number of perspectives: technical, financial and contractual, for instance.
2. Regularly collate relevant reporting data from reliable ‘on the ground’ sources
During any crisis it’s vital to incorporate beneficiary feedback into adaptive management decisions. ODA programme beneficiaries (often government counterparts from the host country) will provide insights into how the situation is affecting their departmental workload and resource availability. Their feedback is invaluable in shaping adjustments to ODA technical support to ensure it still aligns with their departmental priorities.
Data can quickly become inaccurate or outdated in a crisis, so informed analysis and interpretation is required. You’ll need to monitor the local political and socio-economic context from government and related official sources. Local advisors and delivery partners can support data gathering and interpretation to provide a realistic picture, through regular and structured reporting. For example, in Latin America we used data to correlate a connection between the delivery feasibility of a large programme and the interest level and involvement of stakeholders. When COVID-19 led to the government asking public servants in situation of risk to stop working or work from home where possible, this was expected to negatively impact on delivery. Instead, we tracked continued delivery at high levels. This was down to part of the funding for certain stakeholders being diverted to respond to the pandemic, resulting in increased interest in the support provided by the programme.
3. Use interactive data visualisation platforms
Interactive data visualisation supports adaptive ODA portfolio management by providing a picture of the context and its evolution, allowing impact assessment of changes. Donors should use dashboard visualisations to aggregate data gathered at the programme level and address complexity and uncertainty in their ODA portfolios. For example, during COVID-19, UNICEF developed a dashboard using Tableau to demonstrate the socio-economic disruption caused by COVID-19 on service delivery within 202 countries. This kind of interface provides ODA portfolio managers with a clear picture of the impact for their portfolio and which sectors have experienced the most disruption.
These platforms also enable donor governments to access at-a-glance summaries of their global ODA portfolios (often complex groups of multi-country and multi-sector programme interventions) and overlay the country and sector focus of ODA portfolio interventions against this mapping. It’s an approach that Prospero, the portfolio information management system for the UK Government’s £1.2bn Prosperity Fund (PF), supports by providing a portfolio overview map, detailing the country and sector focus of 27 programmes and 152 projects within the PF.
Successful adaptive management requires regular engagement between ODA portfolio managers and programme teams to obtain accurate and reliable information. Each programme within an ODA portfolio has complex design and delivery needs which require careful consideration, scenario planning and risk assessment before adjustments can be made. Interactive data visualisation platforms can help aggregate data gathered at the programme level and address complexity and uncertainty in ODA portfolios.
While no crisis is easy, the steps outlined above will make it easier to identify, respond and adjust to changes along the way. To learn more on how governments can use data to drive decision-making in times of crisis, register for this free webinar on 19 August 2020.
Explore more


